
Thousands of signals, an enormous volume of design modifications during the investment phase, fragmented data provided by each telecommunications discipline. How can you manage all of this while being certain that the integration system — pulling together the efforts of sometimes hundreds of engineers across the full spectrum of disciplines — will implement this vast amount of data without errors?
The modern bloCADe
The number of signals currently visualized in buildings, even those of modest size, is enormous and is increasingly counted in tens of thousands. Let’s be honest — mistakes happen. They often result from documentation issues, numerous design changes, and fragmented configuration data from integrated systems. The larger the facility and the more integrations involved, the more signals require visualization. Even small buildings unrelated to critical infrastructure are bursting at the seams with sensors, security devices, and electronics — and this is undoubtedly becoming more apparent during visualization work.
The process that undeniably requires a significant amount of time during the entire visualization task is placing data points on floor plans that represent the devices of integrated systems. These are typically point-type smoke detectors (fire alarm system), inputs and outputs configured within FPM+ control panels (e.g., HVAC dampers monitored by e.LSK modules), access control passages, detection lines of intrusion and hold-up alarm systems, and CCTV cameras. It is worth noting that developing the visualization is essentially the final stage in the entire process of commissioning security systems at a facility — and as one can easily guess, it is often a stage burdened by tight deadlines due to the looming acceptance activities.
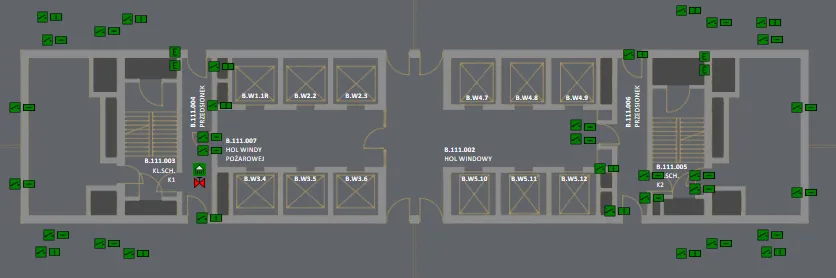
Example floor plan in GEMOS with data points representing fire protection devices connected to the FPM+ control panel (HVAC damper monitoring, sprinkler flow sensors, panel modules)
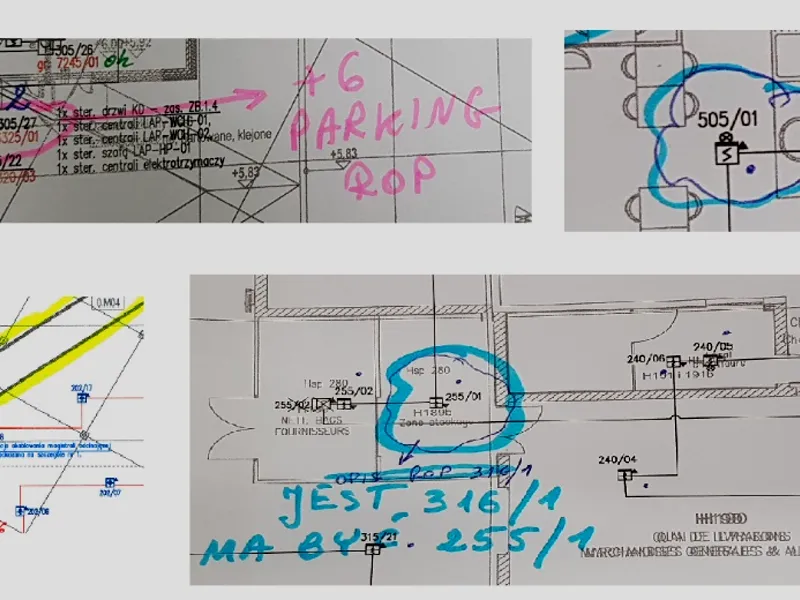
The process of placing data points on plans may seem quick, easy, and pleasant at first glance, but details and problems frequently arise that ultimately affect the time demands of the work. Incomplete documentation, design changes, significant data fragmentation, the need for designers to edit labels to match the technical configuration of the integrated control panel — all of this transforms what is theoretically a simple stage into a process requiring proper management and coordination among multiple parties (the designer, the person preparing the visualization, and the integrated discipline representative).
GEMOS — with aCADemic precision
Considering the above, there is a growing search for tools that automate the data point visualization process — and a good example is the CAD plan import module available in GEMOS, which additionally guarantees full consistency between design documentation and data presented by the visualization system.
The first stage is processing CAD files so they are suitable for automatic import. As one can easily guess, there must be a link connecting the object in the CAD file with the data point in the GEMOS system. The element of this link on the CAD side is a block attribute representing the given element of the visualized security system (e.g., an HVAC damper). At minimum, this means creating an attribute containing an unambiguous element identifier (detector X on loop Y, or damper A on input B of module C from bus D), though naturally there can be more attributes — from symbols to names and additional textual information about location. Each such attribute can be transferred to the GEMOS system, thereby ensuring even greater consistency with the documentation prepared by the designer (as more data will be automatically transferred to the integration environment).
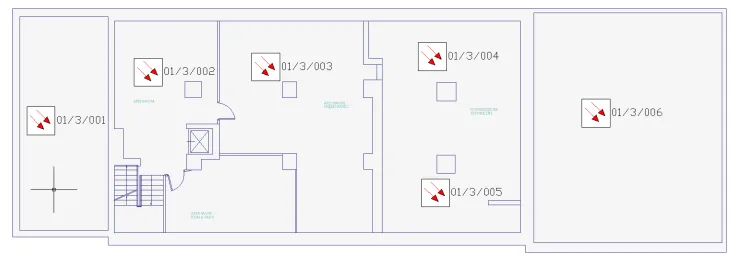
Example CAD plan with block attributes assigned (physical addressing)
On the GEMOS side, the element of this link is an identifier assigned to each data point, generated by the interface and also derived from logical or physical addressing (element number on the loop, group number in a given panel, module address on the selected bus, etc.). As one can easily guess, the second stage is essentially merging the links from the CAD and GEMOS sides. Regular expressions are used for this purpose, enabling the encoding of discipline-specific label sequences as universal character strings. In the vast majority of cases, the syntax used is flexible enough to map even complex “bundles” characteristic of security system configurations.
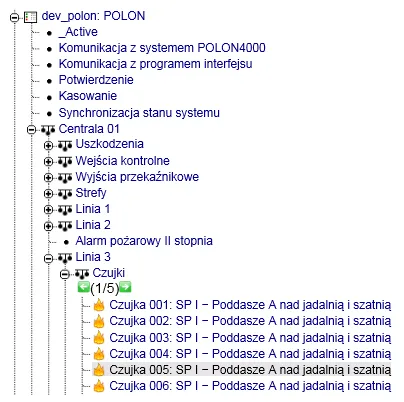
Example fire alarm panel structure in the GEMOS system configuration
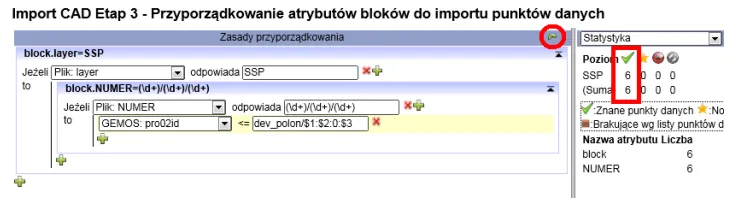
Example implementation of CAD block attribute to GEMOS identifier mapping
A key operational element of visualization is layers, within which integrated system symbols are divided into categories for operational convenience and improved readability — typically related to telecommunications disciplines (fire alarm, intrusion alarm, access control, voice alarm, etc.). It should be noted that when using the described automatic import method, this visualization feature can be preserved — you simply need to ensure that blocks for individual disciplines are placed on separate layers in the CAD project being developed (e.g., fire alarm power supplies, HVAC dampers, fire dampers, access control).
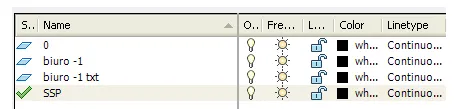
Example CAD layers in a discipline project
Of course, it cannot be denied that preparing CAD files suitable for automatic import requires reserving a certain amount of time (just as with the classic manual approach of placing points on floor plans). Additionally, close coordination between the designer and the person configuring GEMOS is required, along with prior knowledge of the GEMOS identifier structure. Practical experience shows that this mechanism works very well for fire alarm system (SSP) and fire protection control panel (FPM+) deployments — firstly because mapping is relatively simple and readable (uncomplicated addresses resulting from loop designations), and secondly because these disciplines are typically designed at the earliest stage of the investment, allowing identifiers to be provided to the designer well in advance for inclusion in CAD blocks.
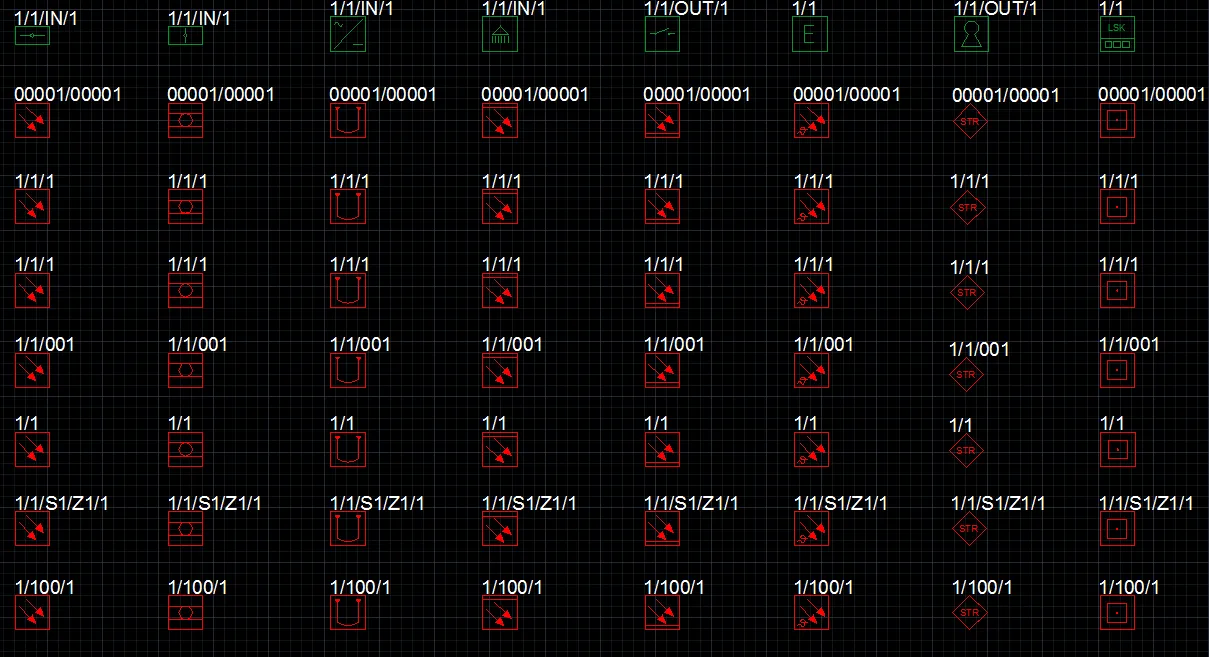
Excerpt from the ready-made CAD symbol library for designers performing automatic import in GEMOS
Summary: don’t overCADplicate — GEMOS will do it for you
We now know what can be done to automate the security system visualization process described at the beginning, avoid inaccuracies, have verified as-built documentation in the integration environment, and simultaneously significantly shorten the time-consuming stage of placing thousands of points on floor plans of an extensive facility. The advantages of equipping discipline-specific CAD designs (e.g., fire alarm systems) with blocks containing attributes that link design labels (panel number, loop number, element number on the loop) with GEMOS designations are increasingly recognized. By performing this kind of mapping, we don’t have to manually place points on floor plans, and secondly, we can be certain that our graphics will contain exactly the points specified by the designer — meaning we simultaneously eliminate potential mistakes during visualization work (duplicate points, missing points on the map, etc.) and create as-built documentation for the entire facility. Let’s add that this as-built documentation is verified — because the import mechanism provides the user with statistics on correctly and incorrectly read data points, among other things.
The mapping process itself is flexible. Firstly, thanks to regular expressions, we can automatically link virtually any identifiers characteristic of a given system (access control, intrusion alarm, CCTV, BMS), and secondly, when design revisions occur, we only update the CAD file without needing to rewrite mapping formulas. Moreover, importing a discipline file doesn’t mean we’re stuck with unattractive CAD maps in our system — mapped signals can easily be transferred to graphics processed in an external graphics program.
In a word: thanks to the CAD plan import module, the most time-consuming visualization process — placing points on plans — “magically” reduces to just a few clicks at the system configuration level.